Inferra AI / Company / TRU
Transunion
TRU · Industrials
Last earnings Oct 27, 2026
Key results
Revenuequarter
8 percent
htm EX-99.1 Document Exhibit 99.1 News Release TransUnion Announces Strong Third Quarter 2025 Results, Exceeding All Key Financial Metrics Delivered 8 percent revenue growth, or 11 percent organic constant currency excluding impact of last year s large breach remediation win in our Consumer Interactive business Accelerated revenue growth in U.
SEC original ↗Transunion — Earnings release (8-K exhibit)EX-99Oct 23, 2025
Accelerated revenuequarter
11 percent
htm EX-99.1 Document Exhibit 99.1 News Release TransUnion Announces Strong Third Quarter 2025 Results, Exceeding All Key Financial Metrics Delivered 8 percent revenue growth, or 11 percent organic constant currency excluding impact of last year s large breach remediation win in our Consumer Interactive business Accelerated revenue growth in U.
SEC original ↗Transunion — Earnings release (8-K exhibit)EX-99Oct 23, 2025
Total revenuequarter
$1,170 million
Third Quarter 2025 Results Revenue Total revenue for the quarter was $1,170 million, an increase of 8 percent (8 percent on a constant currency basis and 7 percent on an organic constant currency basis), compared with the third quarter of 2024.
SEC original ↗Transunion — Earnings release (8-K exhibit)EX-99Oct 23, 2025
Earnings net incomequarter
$97 million
Earnings Net income attributable to TransUnion was $97 million for the quarter, compared with $68 million for the third quarter of 2024.
SEC original ↗Transunion — Earnings release (8-K exhibit)EX-99Oct 23, 2025
EPSquarter
$0.49
Diluted earnings per share was $0.49, compared with $0.35 in the third quarter of 2024.
SEC original ↗Transunion — Earnings release (8-K exhibit)EX-99Oct 23, 2025
Net incomequarter
8.3 percent
Net income attributable to TransUnion margin was 8.3 percent, compared with 6.3 percent in the third quarter of 2024.
SEC original ↗Transunion — Earnings release (8-K exhibit)EX-99Oct 23, 2025
Adjusted net incomequarter
$216 million
Adjusted Net Income was $216 million for the quarter, compared with $205 million for the third quarter of 2024.
SEC original ↗Transunion — Earnings release (8-K exhibit)EX-99Oct 23, 2025
Adjusted EPSquarter
$1.10
Adjusted Diluted Earnings per Share was $1.10, compared with $1.04 in the third quarter of 2024.
SEC original ↗Transunion — Earnings release (8-K exhibit)EX-99Oct 23, 2025
Revenue growth was 8 percent excluding last year s large breach remediation win, organic constant currency growth was 11 percent, our strongest underlying growth since 2021.
SEC original ↗Transunion — Earnings release (8-K exhibit)EX-99Oct 23, 2025
AI analysis
Q3 2025 · reported Oct 23, 2025
Based on: Earnings release + Q3 2025 deck + parent 8-K — transcript not held
The quarter in charts
Diluted EPS — GAAP
Per diluted share, as stated
EX-99 · Oct 23, 2025 EPS values as stated in the release.
Guidance ladder — revenue
Delivered vs the company's guided range
EX-99 · Oct 23, 2025 Guide as stated by the company; range and midpoint computed from the stated figure.
Headline figures
| Metric | Q3 2025 | Prior qtr | Year ago |
|---|---|---|---|
| Revenue | 8 percent | — | — |
| Accelerated revenue | 11 percent | — | — |
| Total revenue | $1,170 million | — | — |
| Earnings net income | $97 million | — | $68 million |
| EPS | $0.49 | — | $0.35 |
| Net income | 8.3 percent | — | — |
| Adjusted net income | $216 million | — | $205 million |
| Adjusted EPS | $1.10 | — | $1.04 |
Guidance · company-stated
Direction: Raised
“Financial Services and Emerging Verticals to 19 percent and 7.5 percent, respectively Increased pace of share repurchases to $160 million in third quarter and October, bringing year-to-date total to $200 million Increased share repurchase authorization up to $1 billion Raising 2025 financial guidance, we now expect to deliver 8 to 8.5 percent revenue growth CHICAGO, October 23, 2025 TransUnion (NYSE TRU) (the Company ) today announced financial results for the quarter ended September 30, 2025.”
“We are raising our 2025 guidance, supported by third quarter outperformance, stable U.”
Classified from the release's primary full-year outlook statement.
Capital allocation
Financial Services and Emerging Verticals to 19 percent and 7.5 percent, respectively Increased pace of share repurchases to $160 million in third quarter and October, bringing year-to-date total to $200 million Increased share repurchase authorization up to $1 billion Raising 2025 financial guidance, we now expect to deliver 8 to 8.5 percent revenue growth CHICAGO, October 23, 2025 TransUnion (NYSE TRU) (the Company ) today announced financial results for the quarter ended September 30, 2025.
What changed vs last quarter
- Guide midpoint vs latest-quarter revenue -86.3% computed from stated figures
Event summary
Earnings Net income attributable to TransUnion was $97 million for the quarter, compared with $68 million for the third quarter of 2024
Based on: Earnings release + Q3 2025 deck + parent 8-K — transcript not held
Guidance & outlook
Direction: Raised
Revenue: “Financial Services and Emerging Verticals to 19 percent and 7.5 percent, respectively Increased pace of share repurchases to $160 million in third quarter and October, bringing year-to-date total to $200 million Increased share repurchase authorization up to $1 billion Raising 2025 financial guidance, we now expect to deliver 8 to 8.5 percent revenue growth CHICAGO, October 23, 2025 TransUnion (NYSE TRU) (the Company ) today announced financial results for the quarter ended September 30, 2025.”
Revenue — Raised (“Increased”)
“Financial Services and Emerging Verticals to 19 percent and 7.5 percent, respectively Increased pace of share repurchases to $160 million in third quarter and October, bringing year-to-date total to $200 million Increased share repurchase authorization up to $1 billion Raising 2025 financial guidance, we now expect to deliver 8 to 8.5 percent revenue growth CHICAGO, October 23, 2025 TransUnion (NYSE TRU) (the Company ) today announced financial results for the quarter ended September 30, 2025.”
Company outlook — Raised (“raising”)
“We are raising our 2025 guidance, supported by third quarter outperformance, stable U.”
Classified from the release's primary full-year outlook statement.
Capital allocation
Financial Services and Emerging Verticals to 19 percent and 7.5 percent, respectively Increased pace of share repurchases to $160 million in third quarter and October, bringing year-to-date total to $200 million Increased share repurchase authorization up to $1 billion Raising 2025 financial guidance, we now expect to deliver 8 to 8.5 percent revenue growth CHICAGO, October 23, 2025 TransUnion (NYSE TRU) (the Company ) today announced financial results for the quarter ended September 30, 2025.
SEC original ↗Transunion — Earnings release (8-K exhibit)EX-99Oct 23, 2025
We have repurchased $200 million in shares year-to-date and increased our share repurchase program authorization to $1 billion.
SEC original ↗Transunion — Earnings release (8-K exhibit)EX-99Oct 23, 2025
We view share repurchases as a highly attractive use of capital.
SEC original ↗Transunion — Earnings release (8-K exhibit)EX-99Oct 23, 2025
The increase in cash used in investing activities was primarily due to our acquisition of Monevo, an increase in capital expenditures and current year investments in a note receivable.
SEC original ↗Transunion — Earnings release (8-K exhibit)EX-99Oct 23, 2025
For the nine months ended September 30, 2025, capital expenditures were $229 million, compared with $199 million in 2024 .
SEC original ↗Transunion — Earnings release (8-K exhibit)EX-99Oct 23, 2025
Capital expenditures as a percent of revenue represented 7% and 6%, respectively, for the nine months ended September 30, 2025 and 2024.
SEC original ↗Transunion — Earnings release (8-K exhibit)EX-99Oct 23, 2025
Strategy & priorities
Forward-looking statements include information concerning possible or assumed future results of operations, including our guidance and descriptions of our business plans and strategies.
SEC original ↗Transunion — Earnings release (8-K exhibit)EX-99Oct 23, 2025
Further, these costs will vary and may not be comparable during the transformation initiative as we progress toward an optimized operating model.
SEC original ↗Transunion — Earnings release (8-K exhibit)EX-99Oct 23, 2025
credit migrations; on track to deliver additional savings in 2026 as anticipated Initiatives: Migrated first customers to OneTru Customers experiencing faster processing and access to innovation like TruIQ Expanded dual run of key customers Deep engagement with largest customers to support upcoming migrations Year-end: Achieve critical mass of U.
SEC original ↗Transunion — Presentation / slide deck (8-K exhibit)EX-99Oct 23, 2025
and the Philippines 2027+: Migrate remaining markets Deliver structural cost savings Achieved targeted 2025 savings Identified incremental vendor and internal savings to deliver 2026 targets 2026: Deliver $35M OpEx savings* and reduce CapEx to 6% of revenue as anticipated to drive margin expansion 2027+: Complete U.
SEC original ↗Transunion — Presentation / slide deck (8-K exhibit)EX-99Oct 23, 2025
Synthetic Fraud Credit Washing Enhanced identity graph Identity Resolution in the Cloud Credit Strategy Studio, part of Advanced Acquisition Behavioral Risk Score, part of Device Risk Audiences expansion Self-serve measurement Branded Call Display Spoof Call Protection Omnichannel platform Global expansion Freemium offering Unified credit education platform Offers-as-a- service (Monevo) All services on global platform OneTru already accelerating pace of innovation New product innovation supporting industry-leading U.
SEC original ↗Transunion — Presentation / slide deck (8-K exhibit)EX-99Oct 23, 2025
Risks & headwinds
These statements are based on the current beliefs and expectations of TransUnion s management and are subject to significant risks and uncertainties.
SEC original ↗Transunion — Earnings release (8-K exhibit)EX-99Oct 23, 2025
You should evaluate all forward-looking statements made in this report in the context of these risks and uncertainties.
SEC original ↗Transunion — Earnings release (8-K exhibit)EX-99Oct 23, 2025
(strongest since 2022), Canada and Africa India grew +5%, with new business wins and innovation outpacing tariff-tempered volumes International1U.
SEC original ↗Transunion — Presentation / slide deck (8-K exhibit)EX-99Oct 23, 2025
Organic constant currency growth guidance raised (prior +6% to +7%) for Q3 outperformance and positive business momentum ~1% headwind from breach win comparison Consumer Interactive up low- single digit excluding breach U.
SEC original ↗Transunion — Presentation / slide deck (8-K exhibit)EX-99Oct 23, 2025
step-up from 2012 change in control and subsequent acquisitions: ~$285M Net Interest Expense: ~$200M CapEx: ~8% of revenue Adjusted EBITDA guidance raised (prior +5% to +7%) Driven by flow-through on stronger revenue growth Adjusted Diluted EPS guidance raised (prior +3% to +6%) Double-digit growth excluding ~4 point headwind from higher tax rate Expect ~70% free cash flow conversion in 2025 (as a % of Adjusted Net Income), improving to 90%+ in 2026 17@ Copyright 2025 TransUnion, its subsidiaries and/or affiliates.
SEC original ↗Transunion — Presentation / slide deck (8-K exhibit)EX-99Oct 23, 2025
Earnings deck slides
4 decks with slide viewTransunion — Presentation / slide deck (8-K exhibit) — Slide view unavailable — this deck was filed as a web document, whose text has no page boundaries.
Transunion — Presentation / slide deck (8-K exhibit) — Slide view unavailable — this deck was filed as a web document, whose text has no page boundaries.
Transunion — Presentation / slide deck (8-K exhibit) — Slide view unavailable — this deck was filed as a web document, whose text has no page boundaries.
Transunion — Presentation / slide deck (8-K exhibit) — Slide view unavailable — this deck was filed as a web document, whose text has no page boundaries.
Competitors
Competitors & peers
Same GICS sector — classification peers, not declared competitors
Filings
26 documents- Q3 2026
- 8-KTRU
Oct 27, 2026
- Q2 2026
- 8-KTRU
Sep 23, 2026
- 10-QTRU
Jul 28, 2026
- 8-KTRU
Jul 28, 2026
- Q1 2026
- 8-KTRU
May 15, 2026
- 10-QTRU
Apr 28, 2026
- 8-KTRU
Apr 28, 2026
- Q4 2025
- 8-KTRU
Mar 10, 2026
- 10-KTRU
Feb 27, 2026
- 8-KTRU
Feb 12, 2026
- Q3 2025
- 8-KTRU
Dec 23, 2025
- 10-QTRU
Oct 23, 2025
- 8-KTRU
Oct 23, 2025
- Q2 2025
- 10-QTRU
Jul 24, 2025
- 8-KTRU
Jul 24, 2025
- Q1 2025
- 8-KTRU
May 9, 2025
- 10-QTRU
Apr 24, 2025
- 8-KTRU
Apr 24, 2025
- Q4 2024
- 8-KTRU
Feb 24, 2025
- 10-KTRU
Feb 13, 2025
- 8-KTRU
Feb 13, 2025
- 8-KTRU
Feb 5, 2025
- 8-KTRU
Jan 16, 2025
- Q3 2024
- 8-KTRU
Dec 17, 2024
- 8-KTRU
Nov 13, 2024
- 10-QTRU
Oct 23, 2024
Earnings releases
16 documents- Q3 2026
- EX-99TRU
Oct 27, 2026
- EX-99TRU
Oct 27, 2026
- Q2 2026
- EX-99TRU
Sep 23, 2026
- EX-99TRU
Jul 28, 2026
- EX-99TRU
Jul 28, 2026
- Q1 2026
- EX-99TRU
Apr 28, 2026
- EX-99TRU
Apr 28, 2026
- Q4 2025
- EX-99TRU
Mar 10, 2026
- EX-99TRU
Feb 12, 2026
- EX-99TRU
Feb 12, 2026
- Q3 2025
- EX-99TRU
Dec 23, 2025
- EX-99TRU
Oct 23, 2025
- EX-99TRU
Oct 23, 2025
- Q2 2025
- EX-99TRU
Jul 24, 2025
- Q1 2025
- EX-99TRU
Apr 24, 2025
- Q4 2024
- EX-99TRU
Feb 13, 2025
Presentations
8 documents




Transcripts
0 documentsNo transcripts for Transunion are held in this edition of the library.
Mentioned by
11 companiesOther tracked companies whose held documents mention Transunion by name or ticker. A mention is counted once per document, from the document text the library holds.
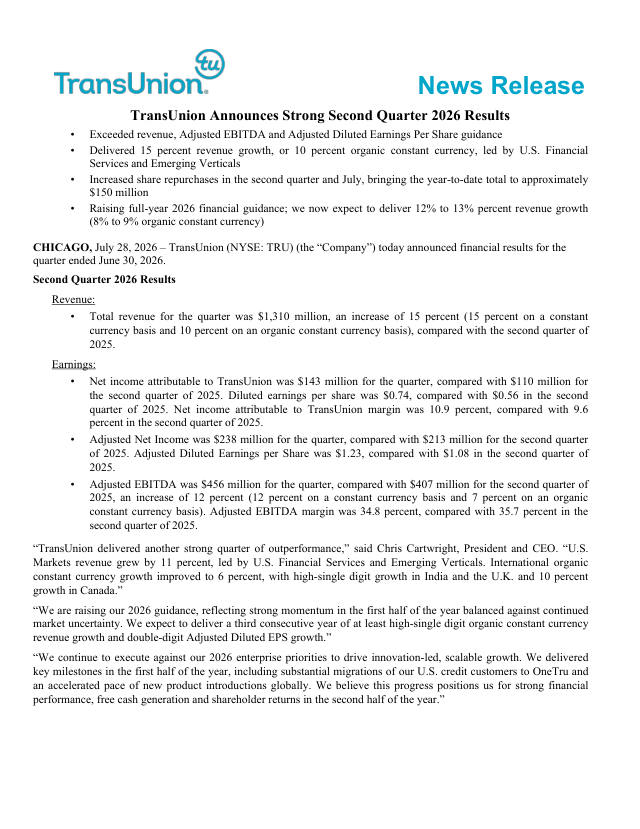
“ility to maintain effective internal control… …(14.5) (18.0) Net income attributable to TransUnion $ 101.2 $ 66.2 $ 455.4 $ 284.4 Basic earnings per common share from: Net income attributable to TransUnion $ 0.52 $ 0.34 $ 2.34”
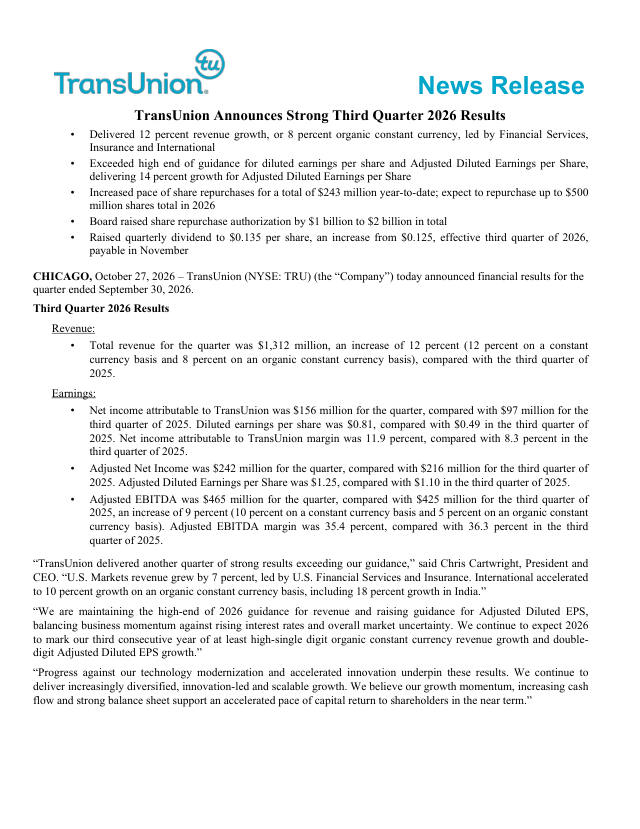
“usiness operations, strategic priorities,… …search for and onboarding of my successor.” TransUnion Reaffirms Third Quarter and Full-Year 2026 Guidance TransUnion is reaffirming third quarter and full-year 2026 guidance for revenue, Adjusted EBITD”
“ability to maintain effective internal control… …(6.7) (7.4) Net income attributable to TransUnion $ 143.4 $ 109.6 $ 540.5 $ 257.7 Basic earnings per common share from: Net income attributable to TransUnion $ 0.75 $ 0.56 $ 2.8”
“0%+ free cash flow conversion as a percentage of Adjusted Net Income © 2026 TransUnion, its subsidiaries… …affiliates. All Rights Reserved. Second quarter 2026 financial results3 Third quarter and full-year 2026 guidance 4 ”
“tive internal control… …noncontrolling interests (3.3) (4.7) Net income attributable to TransUnion $ 397.1 $ 148.1 Basic earnings per common share from: Net income attributable to TransUnion $ 2.06 $ 0.76 Diluted… …Investmen”
“0%+ free cash flow conversion as a percentage of Adjusted Net Income © 2026 TransUnion, its subsidiaries… …indebtedness; our ability to maintain our liquidity; stock price volatility; share repurchase plans; dividend rate; our reliance ”
“h flow and increased shareholder returns.” Reintroducing Medium-Term Financial Framework* TransUnion is reintroducing… …anticipates an increased bias to return capital to shareholders going forward through share repurchases and dividends. Reiterating”
“work and outlook, capital allocation strategy, and descriptions of our … …attributable to TransUnion 455.4$ 284.4$ (205.4)$ 248.9$ 358.7$ Adjustments before income tax items: Goodwill impairment - - 414.0 - - Amortization of certain intangible assets”
Albany International Corp /De/ (AIN)
“ct”). Forward-looking statements include any statement that does not directly… …Textron’s TRU Simulation + Training Inc. He also held various leadership roles in strategic sourcing, supply chain and logistics at Bell Helicopter, including as Executiv”
“…Kumar currently serves on the boards of directors of TransUnion, where he is a member of the Mergers, Acquisitions and Integration Committee and the Compensation Committee, and Digimarc Corporation, where he serve”
“0.15 $ (0.23) 165 % Earnings (loss) per share of Class A common stock—diluted… …include TransUnion's TruAudience identity data, lifting Household ID match rates to 95% of U.S. adults. • Cash flow from operations increased 37% to $51.8 million for F”
See also the earnings calendar for every tracked company’s next earnings date.