Inferra AI / Company / RXO
Rxo, Inc.
RXO · Industrials
Last earnings Oct 29, 2026
Key results
Revenuequarter
$1.4 billion
Companywide Results RXO s revenue was $1.4 billion for the third quarter, compared to $1.0 billion in the third quarter of 2024.
SEC original ↗Rxo, Inc. — Earnings release (8-K exhibit)EX-99Nov 6, 2025
Gross marginquarter
16.5%
Gross margin was 16.5%, compared to 17.3% in the third quarter of 2024.
SEC original ↗Rxo, Inc. — Earnings release (8-K exhibit)EX-99Nov 6, 2025
Adjusted net incomequarter
$2 million
Adjusted net income in the quarter was $2 million, compared to adjusted net income of $7 million in the third quarter of 2024.
SEC original ↗Rxo, Inc. — Earnings release (8-K exhibit)EX-99Nov 6, 2025
EPSquarter
$0.09
Transaction, integration, restructuring and other costs, and amortization of intangibles, impacted GAAP earnings per share by $0.09, net of tax.
SEC original ↗Rxo, Inc. — Earnings release (8-K exhibit)EX-99Nov 6, 2025
Adjusted EPSquarter
$0.01
Adjusted diluted earnings per share was $0.01.
SEC original ↗Rxo, Inc. — Earnings release (8-K exhibit)EX-99Nov 6, 2025
Brokerage gross marginquarter
13.5%
Brokerage gross margin was 13.5% in the third quarter.
SEC original ↗Rxo, Inc. — Earnings release (8-K exhibit)EX-99Nov 6, 2025
RXO s complementary services gross margin was 21.3% for the quarter.
SEC original ↗Rxo, Inc. — Earnings release (8-K exhibit)EX-99Nov 6, 2025
Brokerage3 Volume: Up 1% y/y LTL: Up 43% y/y, 31% of volume TL: Down 11% y/y, 69% of volume TL volume mix: 71% contract, 29% spot Gross margin: 13.5% Productivity gains: +19%4 Complementary services Managed Trans.
SEC original ↗Rxo, Inc. — Presentation / slide deck (8-K exhibit)EX-99Nov 6, 2025
AI analysis
Q3 2025 · reported Nov 6, 2025
Based on: Earnings release + Q3 2025 deck + parent 8-K — transcript not held
The quarter in charts
GAAP gross margin
Percent of revenue, as stated
EX-99 · Nov 6, 2025 Margin values as stated in the release.
Headline figures
| Metric | Q3 2025 | Prior qtr | Year ago |
|---|---|---|---|
| Revenue | $1.4 billion | $1.4 billion | $1.0 billion |
| Gross margin | 16.5% | 14.4% | 17.3% |
| Adjusted net income | $2 million | $7 million | — |
| EPS | $0.09 | $0.09 | — |
| Adjusted EPS | $0.01 | $0.09 | — |
| Brokerage gross margin | 13.5% | 14.4% | — |
Guidance · company-stated
No guidance located in the held release
Margin
Capital allocation
The non-GAAP financial measures in this presentation include: adjusted earnings before interest, taxes, depreciation and amortization ( EBITDA margin ); adjusted EBITDA margin; bank-adjusted EBITDA; free cash flow and free cash flow as a percentage of adjusted EBITDA ( free cash flow conversion ); adjusted free cash flow and adjusted free cash flow as a percentage of adjusted EBITDA ( adjusted free cash flow conversion ); net debt, gross leverage and net leverage; and adjusted net income and adjusted diluted income per share ( adjusted diluted EPS ).
We believe that free cash flow, free cash flow conversion, adjusted free cash flow and adjusted free cash flow conversion are important measures of our ability to repay maturing debt or fund other uses of capital that we believe will enhance stockholder value, and may assist investors with assessing trends in our underlying business.
Event summary
As we navigate this market, everyone at RXO remains focused on delivering results for our customers, carriers, employees and shareholders
Based on: Earnings release + Q3 2025 deck + parent 8-K — transcript not held
Guidance & outlook
No guidance located in the held release
Capital allocation
The non-GAAP financial measures in this presentation include: adjusted earnings before interest, taxes, depreciation and amortization ( EBITDA margin ); adjusted EBITDA margin; bank-adjusted EBITDA; free cash flow and free cash flow as a percentage of adjusted EBITDA ( free cash flow conversion ); adjusted free cash flow and adjusted free cash flow as a percentage of adjusted EBITDA ( adjusted free cash flow conversion ); net debt, gross leverage and net leverage; and adjusted net income and adjusted diluted income per share ( adjusted diluted EPS ).
SEC original ↗Rxo, Inc. — Presentation / slide deck (8-K exhibit)EX-99Nov 6, 2025
We believe that free cash flow, free cash flow conversion, adjusted free cash flow and adjusted free cash flow conversion are important measures of our ability to repay maturing debt or fund other uses of capital that we believe will enhance stockholder value, and may assist investors with assessing trends in our underlying business.
SEC original ↗Rxo, Inc. — Presentation / slide deck (8-K exhibit)EX-99Nov 6, 2025
We believe that net debt, gross leverage and net leverage are important measures of our overall liquidity position.
SEC original ↗Rxo, Inc. — Presentation / slide deck (8-K exhibit)EX-99Nov 6, 2025
Net debt is calculated by removing cash and cash equivalents from the principal balance of our total debt.
SEC original ↗Rxo, Inc. — Presentation / slide deck (8-K exhibit)EX-99Nov 6, 2025
Gross leverage is calculated as the principal balance of our total debt as a ratio of trailing twelve months bank-adjusted EBITDA.
SEC original ↗Rxo, Inc. — Presentation / slide deck (8-K exhibit)EX-99Nov 6, 2025
Net leverage is calculated as net debt as a ratio of trailing twelve months bank-adjusted EBITDA.
SEC original ↗Rxo, Inc. — Presentation / slide deck (8-K exhibit)EX-99Nov 6, 2025
Strategy & priorities
Market tightness is expected to persist throughout the fourth quarter, squeezing contractual brokerage gross margin New cost initiatives expected to yield more than $30 million of incremental savings CHARLOTTE, N.
SEC original ↗Rxo, Inc. — Earnings release (8-K exhibit)EX-99Nov 6, 2025
As we navigate this market, everyone at RXO remains focused on delivering results for our customers, carriers, employees and shareholders.
SEC original ↗Rxo, Inc. — Earnings release (8-K exhibit)EX-99Nov 6, 2025
Wilkerson continued, RXO is well positioned because of our scale as the third-largest brokered transportation provider in North America and the strategic decisions we ve made this year.
SEC original ↗Rxo, Inc. — Earnings release (8-K exhibit)EX-99Nov 6, 2025
Our best-in-class technology is enabling us to realize the benefits of our larger scale, and our new cost initiatives are expected to yield more than $30 million of savings.
SEC original ↗Rxo, Inc. — Earnings release (8-K exhibit)EX-99Nov 6, 2025
3 Q3 2025 highlights 1 Volume outperformance in a continued soft market 2 Continued Last Mile stop growth 3 Strong adjusted free cash flow conversion 4 Full-truckload market has tightened significantly, driven by capacity exits 5 New cost initiatives to enhance operational efficiency RXO is well positioned to deliver strong profitable growth across market cycles 4 Q3 2025 results Revenue by service offering excludes impact of eliminations.
SEC original ↗Rxo, Inc. — Presentation / slide deck (8-K exhibit)EX-99Nov 6, 2025
Risks & headwinds
RXO 3Q 2025 Earnings Press Release 3 These forward-looking statements are subject to known and unknown risks, uncertainties and assumptions that may cause actual results, levels of activity, performance, or achievements to be materially different from any future results, levels of activity, performance or achievements expressed or implied by such forward-looking statements.
SEC original ↗Rxo, Inc. — Earnings release (8-K exhibit)EX-99Nov 6, 2025
These forward-looking statements are subject to known and unknown risks, uncertainties and assumptions that may cause actual results, levels of activity, performance, or achievements to be materially different from any future results, levels of activity, performance or achievements expressed or implied by such forward-looking statements.
SEC original ↗Rxo, Inc. — Presentation / slide deck (8-K exhibit)EX-99Nov 6, 2025
What changed vs prior quarter
Revenue — prior quarter passage and this quarter's passage are both cited.
SEC original ↗Rxo, Inc. — Earnings release (8-K exhibit)EX-99Nov 6, 2025
Gross margin — prior quarter passage and this quarter's passage are both cited.
SEC original ↗Rxo, Inc. — Earnings release (8-K exhibit)EX-99Nov 6, 2025
Adjusted net income — prior quarter passage and this quarter's passage are both cited.
SEC original ↗Rxo, Inc. — Earnings release (8-K exhibit)EX-99Nov 6, 2025
Earnings deck slides
6 decks with slide viewRxo, Inc. — Presentation / slide deck (8-K exhibit) — Slide view unavailable — this deck was filed as a web document, whose text has no page boundaries.
Rxo, Inc. — Presentation / slide deck (8-K exhibit) — Slide view unavailable — this deck was filed as a web document, whose text has no page boundaries.
Rxo, Inc. — Presentation / slide deck (8-K exhibit) — Slide view unavailable — this deck was filed as a web document, whose text has no page boundaries.
Rxo, Inc. — Presentation / slide deck (8-K exhibit) — Slide view unavailable — this deck was filed as a web document, whose text has no page boundaries.
Rxo, Inc. — Presentation / slide deck (8-K exhibit) — Slide view unavailable — this deck was filed as a web document, whose text has no page boundaries.
Rxo, Inc. — Presentation / slide deck (8-K exhibit) — Slide view unavailable — this deck was filed as a web document, whose text has no page boundaries.
Rxo, Inc. — Presentation / slide deck (8-K exhibit) — Slide view unavailable — this deck was filed as a web document, whose text has no page boundaries.
Rxo, Inc. — Presentation / slide deck (8-K exhibit) — Slide view unavailable — this deck was filed as a web document, whose text has no page boundaries.
Competitors
Competitors & peers
Same GICS sector — classification peers, not declared competitors
Filings
33 documents- Q3 2026
- 8-KRXO
Oct 29, 2026
- 8-KRXO
Oct 5, 2026
- Q2 2026
- 8-KRXO
Sep 9, 2026
- 8-KRXO
Aug 6, 2026
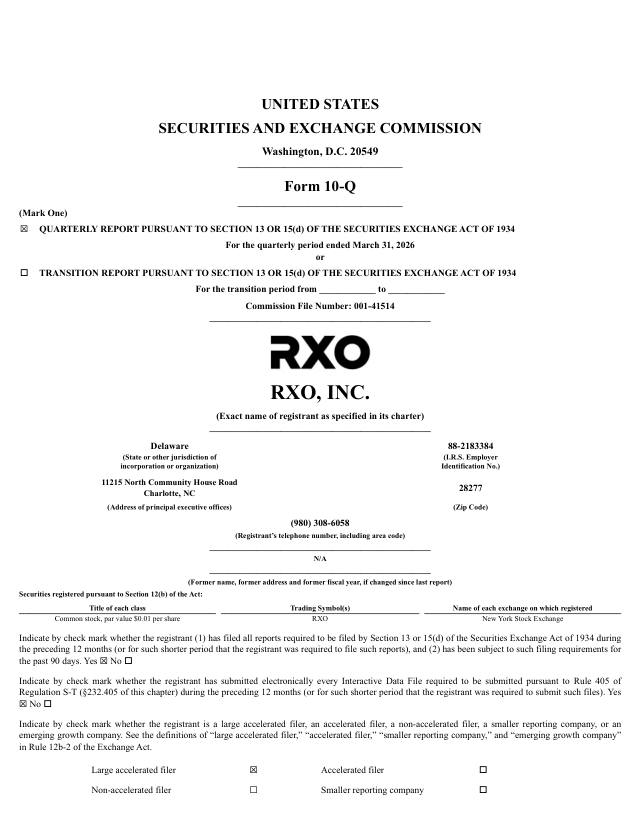
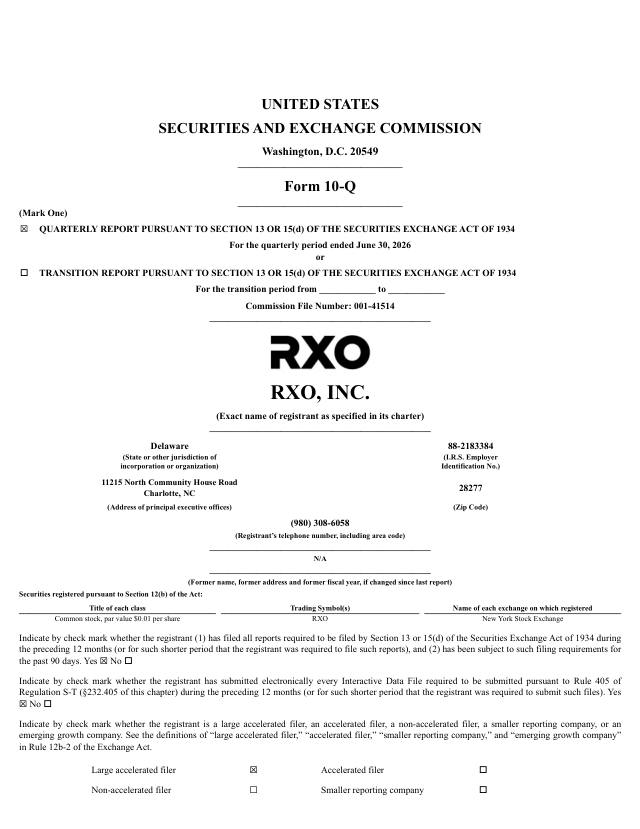
- 10-QRXO
Aug 6, 2026
- Q1 2026
- 8-KRXO
May 13, 2026
- 8-KRXO
May 7, 2026
- 10-QRXO
May 7, 2026
- Q4 2025
- 8-KRXO
Feb 20, 2026
- 8-KRXO
Feb 12, 2026
- EX-99RXO
Feb 12, 2026
- 8-KRXO
Feb 10, 2026
- EX-99RXO
Feb 10, 2026
- 10-KRXO
Feb 9, 2026
- 8-KRXO
Feb 6, 2026
- 8-KRXO
Jan 23, 2026
- Q3 2025
- 8-KRXO
Nov 6, 2025
- 10-QRXO
Nov 6, 2025
- Q2 2025
- 8-KRXO
Aug 7, 2025
- 10-QRXO
Aug 7, 2025
- Q1 2025
- 8-KRXO
May 23, 2025
- 8-KRXO
May 7, 2025
- 10-QRXO
May 7, 2025
- Q4 2024
- 10-KRXO
Feb 27, 2025
- 8-KRXO
Feb 5, 2025
- Q3 2024
- 8-KRXO
Dec 6, 2024
- 8-KRXO
Nov 7, 2024
- 10-QRXO
Nov 7, 2024
- 8-KRXO
Oct 22, 2024
- Q2 2024
- 8-KRXO
Sep 25, 2024
- 8-KRXO
Sep 16, 2024
- 8-KRXO
Sep 11, 2024
- 8-KRXO
Sep 9, 2024
Earnings releases
11 documentsPresentations
14 documents


Transcripts
0 documentsNo transcripts for Rxo, Inc. are held in this edition of the library.
Mentioned by
3 companiesOther tracked companies whose held documents mention Rxo, Inc. by name or ticker. A mention is counted once per document, from the document text the library holds.
“reate a combined company with an enterprise value of over $25 billion. The acquisition of RXO brings together two complementary networks and diversifies and strengthens C.H. Robinson’s multi-modal… …innovative solutions Strong financi”
“… on RXO’s ability to pursue certain business opportunities or strategic transactions; the potential acquisition being more expensive to complete than anticipated, i”
“is release include, among other things, statements concerning the proposed acquisition of RXO, Inc., including the anticipated timing and completion of the transaction; the receipt of required… …changes to our capital structure; changes due to catast”
See also the earnings calendar for every tracked company’s next earnings date.